
Page
CHAPTER 3: RESEARCH FOR PUBLISHING
Completion requirements
CHAPTER 3: RESEARCH FOR PUBLISHING

The aim of this chapter is to build an understanding of research and report-writing methodologies as they apply to the publishing industry.
3.1. Marketing theory and terminology
After studying this section, you must be able to:
- define and apply marketing concepts (such as target market, market share, market size, total actual market, potential actual market, realistic actual market, market segments, sales cycles, etc) to the publishing environment using the correct terminology
- analyze the influence of the political and economic environment on marketing in the publishing sector and the company
- define trends, challenges and opportunities, and assess mechanisms to mitigate or utilize these analyze the effect of technological changes on the marketing of a print / digital product
- analyze sources of existing publishing data in terms of their usefulness for answering specific research questions
- define the concept stage in terms of market research to determine market opportunities, find out about existing products in the market, do product differentiation, and check assumptions
- discuss the development stage in terms of testing the product concept, design, or prototype with the target market through trials in the market, focus groups and interviews
- discuss the post-publication stage in terms of research to determine the success of the product in the market
Chapter 11 focuses on “sales” and “marketing” as functions in a publishing company, and the strategies and activities used by sales and marketing colleagues, as well as your role in assisting them.
In contrast, this section gives you, as a commissioning editor, information on the market and marketing that you can use yourself as you conduct research related to the core focus of your job – managing a list of titles.
The key concepts you need to understand are below. They are so important you will read about them again and again throughout this textbook. They are also all included in the Glossary:
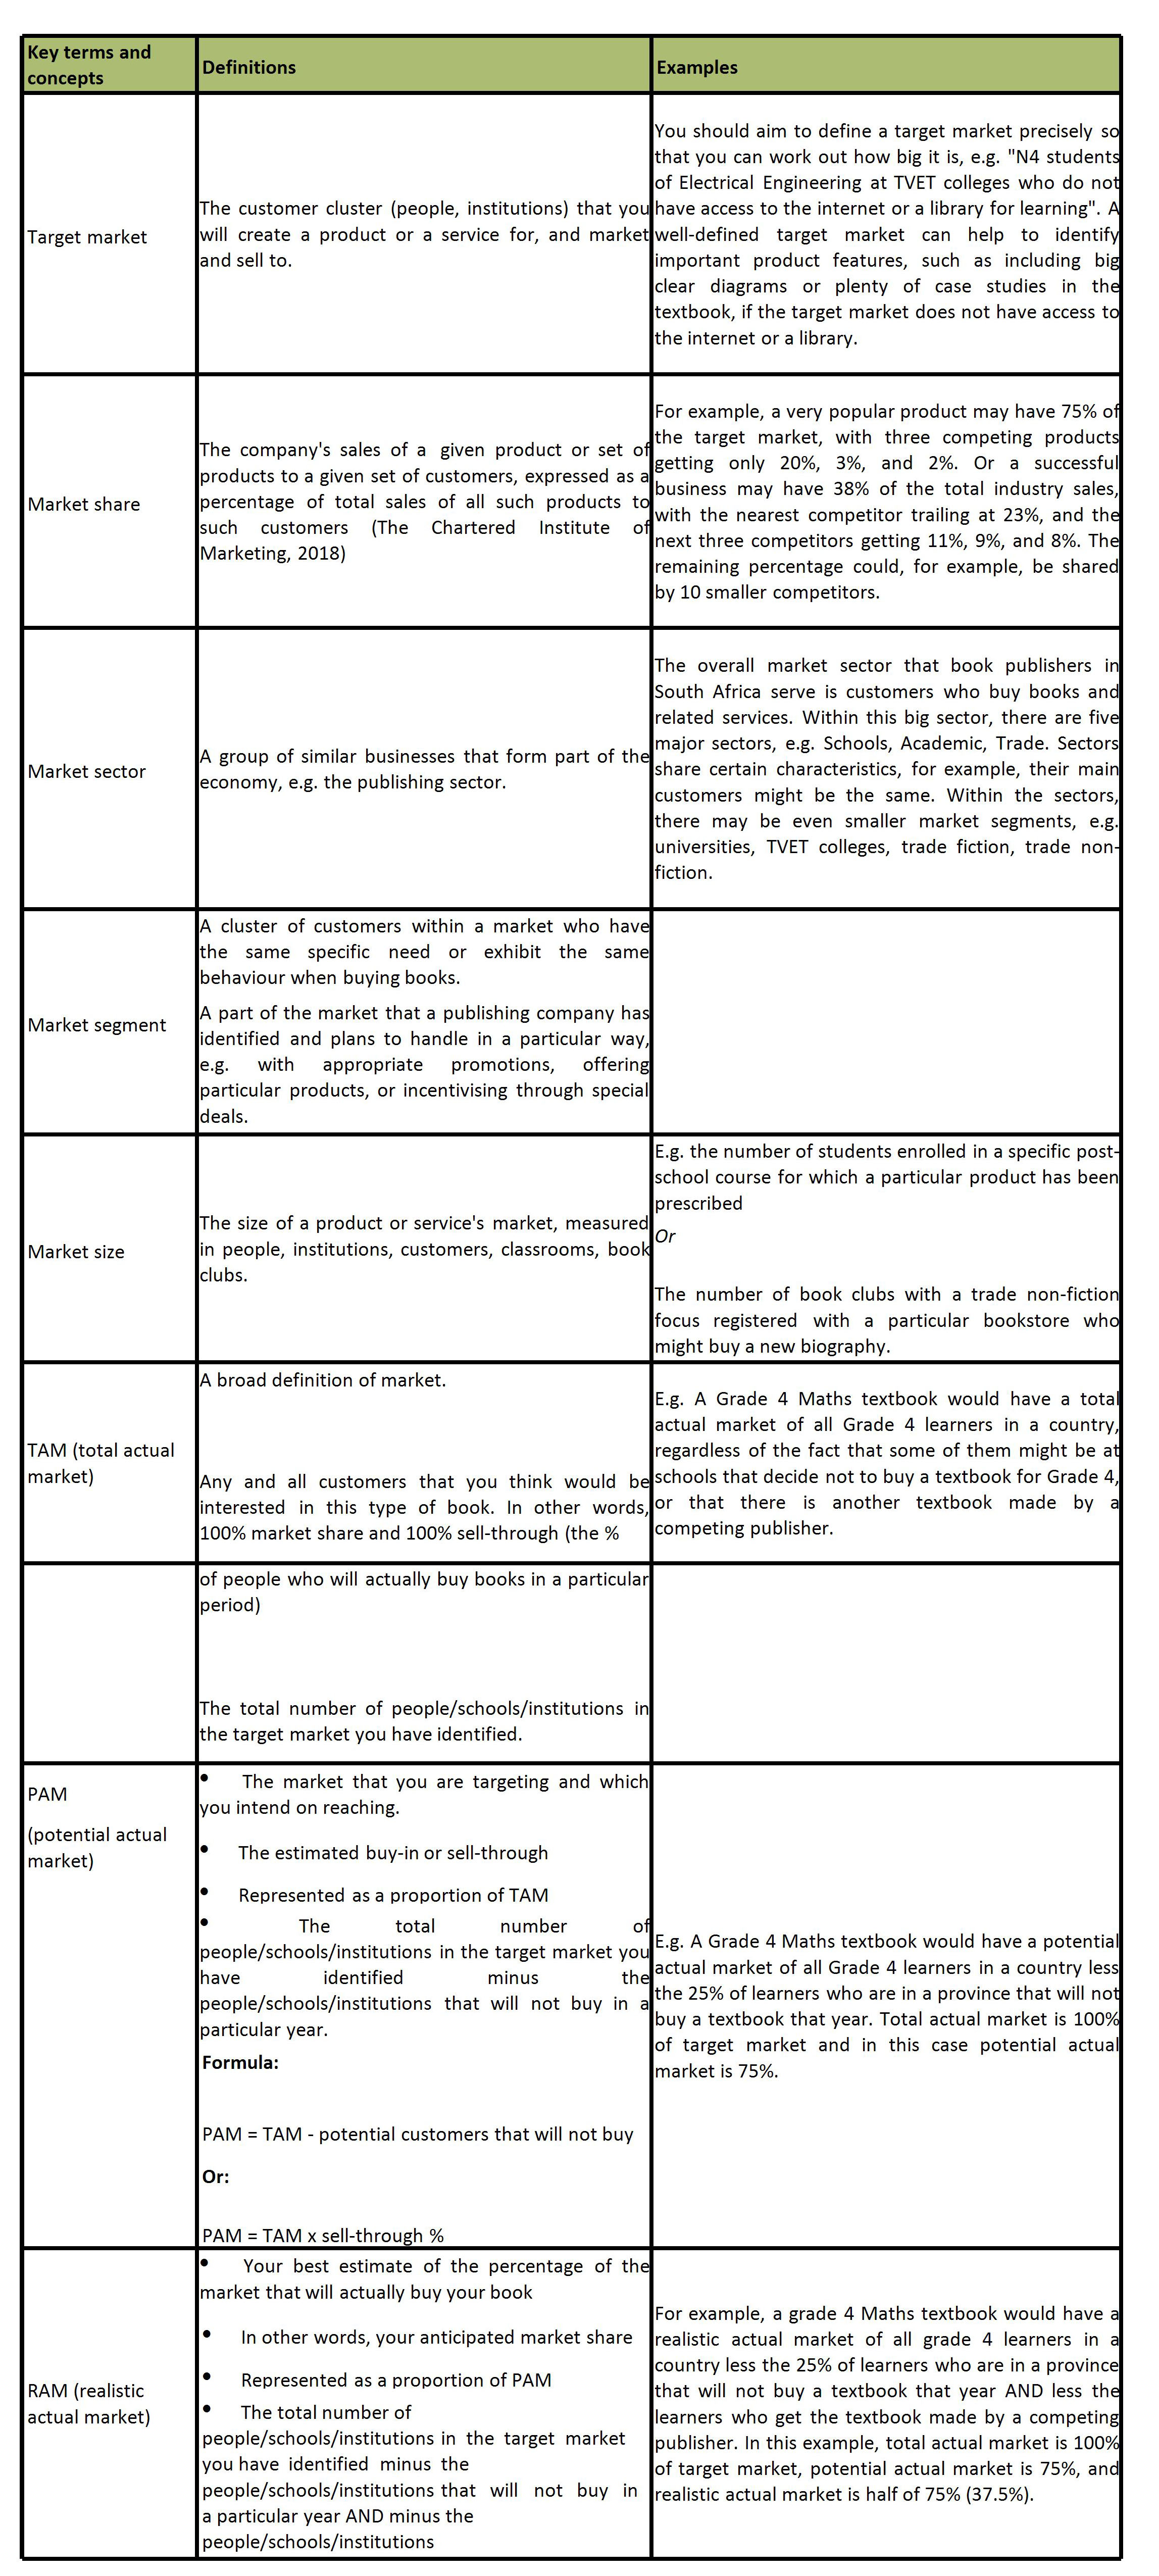
Table 3.1. Key concepts regarding the publishing “market”
Before we move on, let us make sure you fully understand the concepts of TAM, PAM, and RAM. They are really important. You will use them again and again as you compile publishing proposals and assess the performance of products you publish.
Read through the explanations and formulae given for TAM, PAM, and RAM in Table 3.1 again.
Another way of thinking about them is depicted in the diagram below. It shows the relationships between TAM, PAM and RAM – and how each is a smaller proportion of TAM.
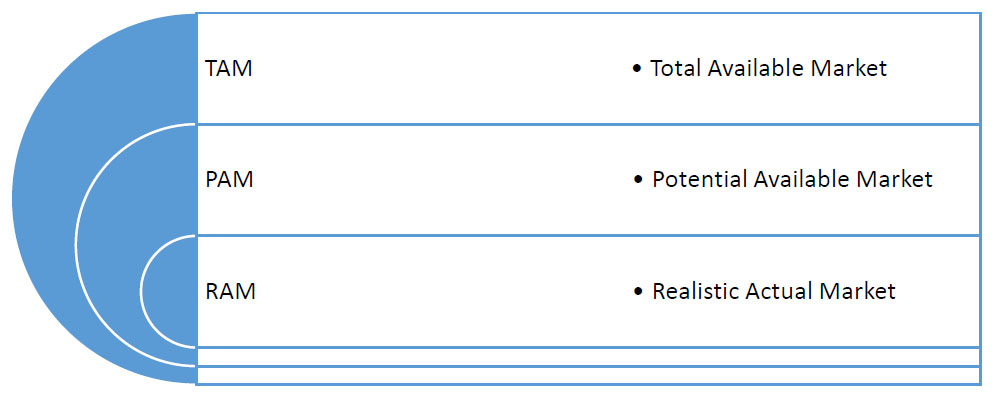
Diagram 3.1. The relationship between TAM, PAM and RAM
- TAM refers to the total available market. This is a broad definition of the market and includes any customer that you think would be interested in this type of product.
- PAM refers to potential available market. This is the market that you are targeting and that you intend reaching. In other words, this is the market you hope buys your product. It is represented as a proportion of TAM.
- RAM refers to realistic actual market, or market share. This is usually your best estimate of the percentage of the market that will actually buy your product. If you are making a new edition of a product or a product in a series, you can use sales figures of the current edition or an already- published book in the series to inform your calculation of RAM. These figures will give a reasonably accurate idea of market share.
When you conduct research for a publishing idea, it is useful to know how the publishing environment in the different market sectors differs.
If you need enrolment figures for a particular university course, you will need to approach different people to those you would approach if you needed enrolment figures for school children. For university course enrolments, you will need to go to an individual department of a particular university, whereas for schools you could search online for the latest version of the School Realities document produced by the Department of Basic Education's Education Management Information System (EMIS) staff.
The School Realities document gives information for all schools, whether public or private, across all provinces, and can be downloaded from
https://www.education.gov.za/Programmes/EMIS/StatisticalPublications.aspx.
HEMIS information (which stands for Higher Education Management Information System) is similar to EMIS information, except it is for higher education. The Government ministry, the Department of Higher Education and Training, is a source of enrolment information for university courses at public universities. See http://www.dhet.gov.za/HEMIS/Enrolment
Each university is responsible for gathering and retaining HEMIS information for planning purposes. Another way to obtain information is for a researcher to contact each relevant department or unit at each university or college, and to piece together the data gathered.
If you are working in trade fiction (or non-fiction), it may be very helpful for you to know whether the proportion of the South African population who is able to afford books has increased or decreased. This can be measured in various ways, including LSM (Living Standards Measure – LSM 7- 10 may be the segments that might be useful to you) and the newer SEM (Socio-Economic Measure
– SEM 8-10 may be the segments useful to you) has increased or decreased. Both are ways of segmenting the population: the LSM mostly according to what they own, and the SEM mostly according to how they live; an online LSM calculator is available here: http://www.eighty20.co.za/lsm-calculator/) and there is more information on SEM here: https://mobimedia.co.za/why-lsm-is-being-replaced-by-sem/
and https://themediaonline.co.za/2017/04/measuring-how-people-live-not-necessarily-by-what- they-have/.
You may also need to know what the Consumer Price Inflation, or CPI, is, because this could influence how much money your market has to spend on non-essential items, like books.
Finally, it may be helpful to understand whether the economy is buoyant and growing (or stagnant or shrinking), and how confident people in general feel. These factors play into how much money people are able to, or willing to, spend on non-essential items, such as books and DVDs. To keep up to date, consider reading a print or online newspaper or magazine with a business focus, e.g. Business Day or the Financial Mail. You can also listen to radio shows with this focus to become better informed – and to stay informed.
Knowing your company and the publishing industry will help you to understand the context in which you're working. Bad decisions are rarely bad decisions in every situation – usually, they are only bad decisions in context. In other words, they are bad decisions considering what else is happening, or likely to happen, around you. If you don't know what is happening in the industry around you, you are more likely to make bad decisions.
Knowing your own company is a good place to start. It is very important to be clear on what your
publishing company's strategy is, and how your role fits into that.
Some people feel that a business strategy must be a very complicated thing, or else is something completely confidential. Neither of these things is true. It's true that the financial accounts of a business are confidential, and shouldn't be shared with competitors, but the strategy of the business should not be a secret to staff members.
A business strategy should be something that every staff member understands because it can be as simple as knowing what the company wants to do, and doesn’t want to do. Which markets do you want to serve, and which would you rather leave alone – and why? You might need to think about "markets" in more detail (e.g. subject areas, product types, customers, languages, levels, distribution channels) but the core of a strategy should be simple enough to remember and hold in your mind constantly. It should be something you use as a criterion to evaluate your ideas, and which you consider when you are conceptualising a new product or publishing proposal.
Secondly, you need to know about your competitors. This is a list of examples of what you might benefit from knowing about them:
Their bestsellers Their market share
Trends in their sales (up or down) Who their customers are
Why their customers choose them: e.g. is it brand, product, approval, sales activity, endorsement by a powerful person or institution?
Their strategy
Their strengths and weaknesses, and the shape of their range Their forthcoming titles
Their staff members and their skill level
How many sales staff they have in the market.
If you know some of these things about your competitors, you will also start to build up a picture of the publishing industry as a whole. Which companies compete directly with the one you work for, which are a threat because they are growing, which are going through a difficult period, e.g. losing the head of the organisation, or being restructured?
As you gain experience as a commissioning editor and build up your knowledge of the industry over time, you may also start to get a sense of policy changes that might affect you, such as changes in copyright law. You will bring all of this knowledge and understanding to your projects and ideas.
The purpose of collecting market information is to have evidence on which to base your calculations, evaluations, and decisions. Being a commissioning editor is seldom about publishing what you, as an individual, like, or find interesting. After all, you may not be a representative of your list's target markets. Rather, you need to publish what your company’s publishing strategy focuses on, what the target market needs and wants, and what your sales and marketing colleagues want to sell and market. There is a role for a commissioning editor's personal preference and taste, especially when you're publishing trade fiction, but that can't be the only criteria.
When you present a publishing proposal to senior management, you must have clear evidence to support your sales projections and your product concept. Anecdotal evidence, such as "I think it will sell because a student I spoke to says they need something just like this" or "the school down the road says they'd definitely order it and I'm sure lots of other schools will feel the same way", will not be sufficient to support your proposal. (For more on publishing proposals, see Chapter 4.)
Rather than presenting a publishing proposal to senior management as "a product that I think will sell because a student I spoke to says they need something just like this" or saying that you based your sales projections on "the school down the road saying they'd definitely order it and I'm sure lots of other schools will feel the same way", you must have evidence for your sales projections and your conceptualisation. (For more on publishing proposals, see Chapter 4.)
This is especially true of educational publishing (for schools or higher education). In these markets, you can gather hard facts such as enrolments, university or government policy documents, research with lecturers or teachers. You can use your analysis of these to inform your proposal. With a novel, on the other hand, the commissioning editor can use hard facts such as the sales history of similar products, and information about the strength of the economy. But she will also need to draw on her understanding of trends in the market sector she is working in, and what constitutes appropriate writing for this sector.
In either situation, a commissioning editor must focus outwards, on the market, not only inwards, on his own preferences, or his company's.
Most commissioning editors collect market information so that they can use it before publication, in their publishing proposals. But it is also useful to have it after publication.
It is worthwhile to evaluate how successful a product has been after publication. You can do this once about 12 months have passed (as a minimum). If you see then that the sales figures are not as good as you’d projected, or they're much better, you may want to gather information from the market about the reasons. You can read more about this kind of research in Section 2.3.2.
When you are researching a new idea for a product, you may feel unsure of how you’ll find out what you need to. Perhaps you have not had any training or past experience on how to do research. Always remember that you can draw on other people's research that has been published – you do not need to do everything yourself. In fact, knowing whether there is existing information, and finding this, can save you a lot of time. In some sectors, you need the same kind of information for almost all of your proposals – you just need to ensure you use the most up-to-date information each time.
Using other people's research, or publicly available data, is sometimes called desk (or secondary) research. It is research where you review other people's data and findings rather than collecting your own. Desk research contrasts with field (or primary) research, which is research where you gather your own data, often by interacting with the market.
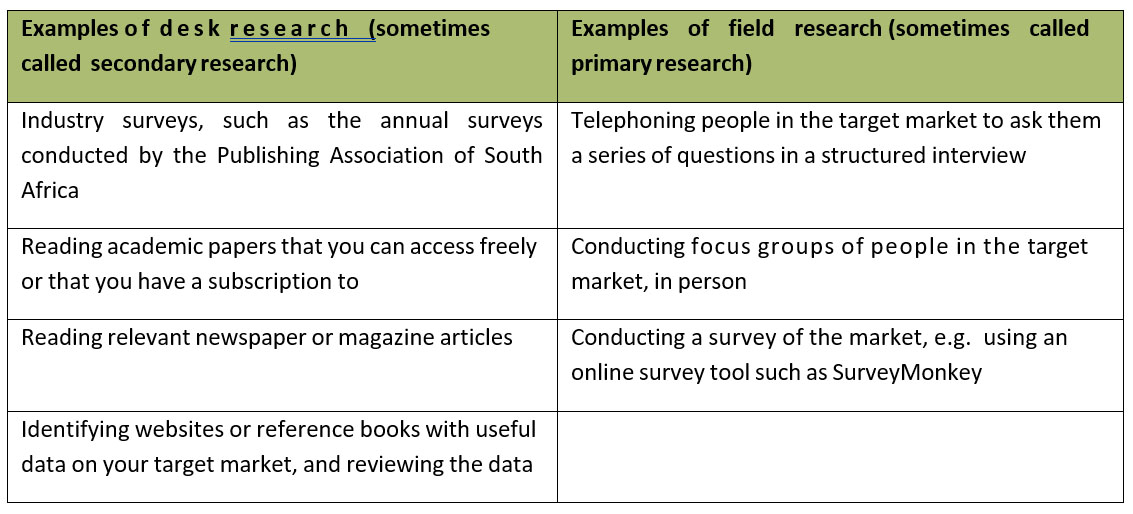
Table 3.2. Examples of desk research and field research
When you are using other people's research, make sure that they have a good reputation. Evaluate their research methodology, because you want to be sure that their conclusions are valid. When you
are conducting your own research, ensure that your own research methodology is appropriate. See Section 3.2 in this chapter for ways of conducting your own research.
Finally, remember to acknowledge your sources. For example, if you use a research paper, give its full bibliographical detail, so that someone else can find and read it for herself. Not only is it the correct thing to do, but it also means you can go back and check your work if you need to (rather than trying to identify the same paper again without a title or author to hand).
There are three broad stages of publishing at which you can consider doing research:
- Before publication
- During development
- After publication.
Before publication: You will almost always need to do some research as part of your preparation for a new publishing proposal. This is discussed in Chapter 2, and Chapter 4.1.
After publication: Research into back list product is discussed in Chapter 2.3.
During development: If you are starting a new project that will take a long time to develop and publish, or that will cost a lot to develop and publish, or you are in an environment that is changing very rapidly, you may decide to build some research stages into the development project before publication. It's worth doing this for projects that are material, in other words, they have the potential to impact the whole business either positively or negatively.
Let's look at the reasons you may want to do research during development.
If your project will take a long time to develop and publish, or will cost a lot, your company will have invested considerable resources in it. To reduce the risk to the business of the project failing, it makes sense to check in with the market during the development period, by doing some research. This enables you to either confirm that the development is headed in the right direction, or, if that is not the case, to change course before the project is complete.
If you are in an environment that is changing very rapidly, perhaps with a digital product, it makes sense to check in with the market during development to confirm that nothing has changed that could impact on your project's potential sales. If something has changed, you’ll be able to adapt how you are developing the product to align with the new features of the environment.
There are several different ways you can tackle research during development:
- Create a prototype or mini-version of the product, e.g. a complete and almost final version of a chapter or module, or other part of the complete product. Get members of the target market to use it. This could be in a controlled environment such as a computer lab or focus group, or you might feel comfortable giving your mini-version to research participants to take away and use for a certain length of time in an environment that is more like a real-use environment.
- Develop the complete product to a draft level. It may be unedited or not have final artwork or animations. Ask research participants to use it for a structured (or unstructured) purpose. A structured purpose might be to answer a worksheet you give them. An unstructured purpose would allow participants to use it in whatever way occurs to them, and then report back to you on their experience.
- For a digital product, create a controlled access version of a website or app, allowing research participants to use it in a similar way to how the complete product would be used. Then use data from the website or app on how users interacted with it to inform your product development. This method allows you to see what users actually did, rather than relying on what they said they did. (Unfortunately, research participants do not always tell the truth, often because they have an underlying desire to please the company or person conducting the research. This is called social desirability. Avoiding opportunities for social desirability can enable better research).
- Ask an expert or experts to review a draft product, partial or complete, and comment on particular aspects of it that you are concerned about.
You might want to do more than one stage of research during development, or use more than one research methodology. For example, you could develop a complete module, get user feedback on that (research stage 1), develop the remaining modules to a draft stage, and get an expert review on all the modules (research stage 2).
These can all be powerful ways to develop a strong product. They can provide you with information you can share with your sales and marketing colleagues during the development phase. Seeing positive research feedback during development can make sales people more excited or more confident about successfully selling the product.
Finally, you can consider whether any of your research can be structured in a way that gives you useful positive comments about your product from the target market (or experts relevant to the target market). You can use these to market your product, e.g. on the cover, on social media, in promotional events, or videos. Just be careful that you get the permission of the person you want to quote before you use her comment and her name.
After studying this section, you must be able to:
- describe types of research (such as market, product, industry trends, qualitative, and quantitative) and reason the utilisation and application of the various types
- identify appropriate research mechanisms and define the use according to types of research
- evaluate requirements for research questions and methods of formulating them
In publishing, we use several types of research to gain a better idea of the market, products, and industry trends. We use qualitative research, quantitative research, or a combination. Sometimes the commissioning editor does this research, and sometimes they might outsource the research to a colleague, such as an assistant commissioning editor, or to a freelance researcher.
During market research you find out about the people who would buy the product (also known as the market for the product). For example, the size of the market, where they are, how much they can spend, if and how they use similar products, and their preferences (such as print or digital).
Product research helps define a specific product, either planned or existing. Focus on the details of the product to ensure that it is tailored to what the market needs. For a new product you ask questions such as: What is the best extent? Which topics should it include? Should it be electronic or print? Which features it should have? For an existing product you find out how it is being used by the
market, how users feel about it compared to other products, and how they would like it to be updated.
Research into industry trends reveals what is happening or popular in the market, for example, products containing recipes for healthy meals, apps for learners struggling with maths, or students sharing textbooks. You can use these trends to predict what could happen in future. For example, a decline in sales of products, such as recipe books for cakes, or an increasing demand for educational apps in other key subjects, or licensing ebooks to users for short periods to reduce costs.
Qualitative research focuses on measuring or describing the quality of something. You use qualitative research to find out about customers’ opinions. It often relies on small numbers of participants who evaluate or describe their experience.
Quantitative research focuses on measuring or describing the quantity of something. This type of research often requires greater numbers of participants and seeks to answer questions such as how many people use a product and how many rate the product at a particular level.
There are five steps in the basic research process, as shown in Diagram 3.2.
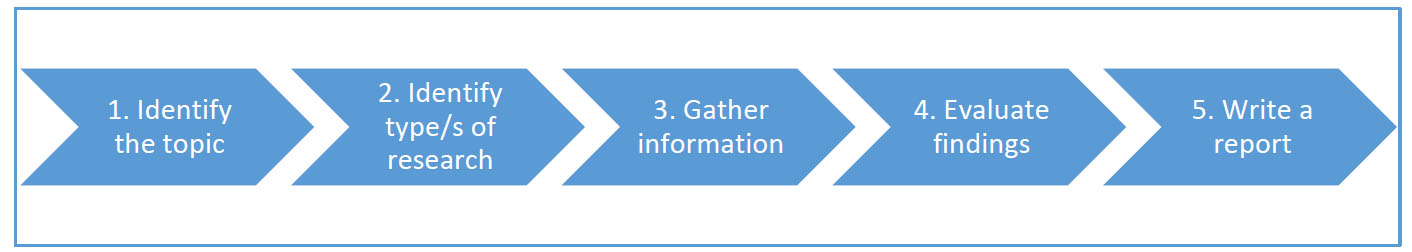
Diagram 3.2. The research process
Step 1 is identifying the topic of research, for example, the need for a product such as a children’s picture book about saying no to bullying.
Step 2 is identifying the types of research to be conducted, such as market research to confirm whether there is a need for the product, and product research to find out what the product should look like and include.
Step 3 involves gathering information using appropriate research instruments (see below).
Step 4 is analysing and evaluating what your research reveals. You may also come up with draft recommendations during this step.
Step 5 is writing a report that clearly arranges and summarises your research findings and recommendations.
- There are important ethical issues to consider when collecting data:
- Be transparent. Identify yourself and give clear details of who you are, what you are doing, and why.
- Mention the type of questions you will be asking and how much time it should take.
- Obtain informed consent from research participants and ensure that they participate freely, i.e. they must know what they are doing, and should not be forced to participate in the research.
- Protect research participants from harm
- Respect the confidential nature of the information research participants provide and keep their responses anonymous in your report.
- Be aware of and sensitive to cultural, gender, and religious differences so that you do not cause offence and so that you avoid making assumptions about research participants based on these aspects.
When working with children under the age of 18 the same considerations apply, but you must first obtain the written consent of parents or guardians and/or teachers. Most companies request parents or guardians and/or teachers to complete a release form or a consent form, however an email will suffice. You should also obtain the consent of the child. Ensure that there is no exploitation of the research participants and that they are safe.
Research instruments are tools for obtaining data, for example, surveys, interviews, focus groups, and desk research.
You use surveys to obtain information from individuals when you are scanning the market. Scanning the market is when you monitor what is happening in the market so that you can ascertain what customers need, keep an eye on what competitors are doing, and keep up-to-date with changes in technology that might disrupt the market or present new opportunities. You design a questionnaire and email it or administer it electronically using online software such as SurveyMonkey (http://www.surveymonkey.com). Alternatively, you note subjects’ responses to your questionnaire during telephone or Skype calls or face-to-face meetings. Surveys can contain qualitative and/or quantitative data.
Interviews are a qualitative method where you ask interviewees questions to obtain deep and detailed insight into their experience and perceptions. Interviews can be structured or semi- structured.
A focus group is another qualitative method. You select a small group of people from your target market to take part in a planned discussion to obtain insights about their opinions.
Desk research involves finding existing data that is freely available, usually online. For example, online catalogues, institutional websites, and online bookstores contain or offer useful information, as do your company’s database and sales colleagues. (See also Table 3.2.)
Research questions and questionnaires must be carefully formulated so that you obtain useful, relevant data. The way you ask the question determines the quality of the data you gather.
Keep questionnaires short – research participants may be put off by a long list of questions. Questions should be concise and unambiguous.
Decide when to use closed-ended questions that require a “yes” or “no” answer. For example, “Would you recommend publishing this product?”. Decide when to use open-ended questions that elicit more information, but are more time consuming. E.g. “Discuss which, if any, aspects of the
product you enjoyed.” Avoid biased questions, such as, “Discuss which aspects of the product you enjoyed” – this assumes that the subject liked the product.
Avoid including more than one thought in a question, such as, “Mention two strengths and two weaknesses of the manuscript”. Rather split this into two questions: 1) Mention two strengths of the manuscript. 2) Mention two weaknesses of the manuscript.
When using scales, usually giving five options is best. For example: How many products have you purchased in the past year?
|None| |1 to 5| |5 to 10| |10 to 20| |more than 20|
Think about the mode of your questionnaire (email v telephone) and adapt the questions accordingly. For example, if you plan to read out the questions over the phone, they should be worded in a more conversational tone than if you are sending them by email.
Remember to include questions that will give insight into what device and applications readers are using, and whether or how much readers have access to the internet and/or cellphone data. This is particularly relevant for the schools and higher education markets.
3.3.1. Drawing up a
competitor analysis
Knowing your competitors is an important part of developing a successful publishing list. Users of your products may compare your products with those of other publishers – you want to give your product the best chance of being chosen over the competition.
When you draw up a competitor analysis, you will need to gather basic and more advanced data about the competitor product, and you will need to interpret that data so that you can use it to improve your own product.
The most basic data you will need to gather about competitor products could include: Title
Author/s Publisher Publication date
Price (you may want to look at the price on the publisher's website, as well as the price on various other platforms, e.g. Takealot, specialist booksellers)
Print and/or digital (if digital, the delivery platform/s used) Format (e.g. A4, or 297 x 210mm)
Extent (e.g. 256 pages)
Paper (e.g. 80gsm)
Colour (e.g. one colour / black, two colour, full colour) Binding (e.g. threadsewn, perfect bound)
Depending on the type of product, advanced data you may want to gather could include: Stated target market
Stated unique selling points (USPs) – often given on the front or back cover, or on a marketing brochure or flyer for the product. Unstated USPs might include notable authors.
Structure of the book, or structure of the chapters
How many illustrations or case studies (or other features) Curriculum or course coverage, if it is an educational product Language level
Support material, either in the product itself, or available for sale or free alongside it
Sales quantities, if you have access to information or can gather anecdotal comments from booksellers or similar
Market response (e.g. anecdotal comments) or reviews (e.g. published in a newspaper/journal/magazine, or on a review site such as Goodreads)
Position in the publishing company's range (e.g. key product) or product life cycle (e.g. Cash Cow)
For the advanced data especially, you will probably find that you start interpreting, as well as gathering, the data. This is useful. For example, for language level, you might use an online readability checker (such as http://www.readabilityformulas.com/free-readability-formula-tests.php) and record the score, but you may also then comment on how suitable this is for the target market.
You can use a table in Word or a spreadsheet for your competitor analysis. Focus on the most important competitors and the most important data types. You don't need to gather everything that's listed here to do useful competitor analysis – rather focus on the aspects of your competitors that will make the most difference, if you know them.
Be prepared to review your competitor analysis template each time you use it and update or adapt it if you need to. There's no point spending time counting how many illustrations your competitors have if this is not an important factor in the opinion of your target market.
When you start doing competitor analyses, you may find that you gather more information than you really need; this is natural, but you will learn from practice and be able to focus your analysis better in future.
Unique selling points, or USPs, are the features of a product that make it different to other competing products. USPs should offer benefits to users of the product. These are often noted on the back (or front) cover of a product, or in the marketing material. USPs are what a sales person should be able to use in a presentation or one-to-one conversation with a potential customer to convince them to buy the product.
If you have done thorough market research and good competitor analysis, you can use the relationship between the two to come up with USPs for your new product.
For example, if your market research shows that lecturers want and need the following from a textbook:
- Appropriate language level (identified as Grade 10 reading level)
- A choice of two case studies per chapter
- Free support material including a question bank and supplementary case studies (one extra per chapter)
- Language level: Grade 12 on average
- A choice of two case studies in 50% of chapters
- Free support material including a question bank and PowerPoint slides (five per chapter)
- Language level: Grade 10 in every chapter
- A choice of two case studies in 100% of chapters
- Free support material including a question bank, PowerPoint slides (two to five per chapter), and supplementary case studies (one extra in 50% of chapters, two extra in 50% of chapters)
This way, in each area (language level, number of case studies, support material), your USPs either match lecturers' needs or exceed them, and either match or improve on the main competitor's offering.
You may also decide to add one or two further features that you think will delight your potential customer and that relate to their identified needs. In this example, these could be a vocabulary help feature with a self-test offered as part of the free support material, plus a list of websites that offer new case studies.
It's possible to think of good USPs as coming out of the gap between market needs and competitor USPs, and even to express this as a formula:
Market needs – Competitor USPs = New product/edition USPs
Good research will help you to identify the sweet spot of unmet market needs, so you can develop a product with USPs that meet them.
Remember! In real life, the development of USPs is seldom as neat as the example given here. For example, it may cost too much or take too long to develop content to meet all the market needs that your market research identified. Or your competitor may have met all the important needs already, leaving you very little to focus on in your product's USPs. Even if that is the case, you will still develop a better product if you have done market research and competitor analysis than you would have without it.
Choosing the best research
for your purposes
is important. Take time to evaluate the options,
rather than being in a hurry to choose one
and
move on. Try to select sources that are reputable, objective and
up-to-date.
Reputable: The researcher or organisation should be well-regarded in the field. For example, a government body like Statistics South Africa (http://www.statssa.gov.za) which is the source of many official datasets, an accredited journal in a relevant field, or a tertiary institution lecturer who is NRF- rated, who has won an award, or whom other lecturers have told you is knowledgeable and competent.
Objective: The researcher or organisation should not accept funding that could give the appearance of a conflict of interest, or that results in an actual conflict of interest. Review the organisation's "About" page or other sections of its website, and Google it and see if it has appeared in the media in connection with something inappropriate.
Up-to-date: Find the most up-to-date version of the data you need. Some datasets or research reports are released regularly, e.g. every year. If so, the most up-to-date version may not be from this year, as it takes some time to gather data, analyse it, and report on it, but you should find the latest data available. If possible, find out when the report is usually released – if it's very soon, you may want to delay your report until it has come out.
Finally, see if you can find more than one independent source saying the same thing, or more than one way of coming to the same conclusion. Both of these things can suggest that your research is robust, and your conclusions are solid; this is especially useful if your research comes to some unusual or innovative conclusions.
3.4. Collecting, storing, and recording data
After studying this section,
you must be able to:
- Argue the importance of applying correct procedures for ensuring the security of information, the correct recording and storage of information.
- Justify the importance of current information.
- Evaluate requirements for the flow of information in the organisation and between roleplayers.
When working with data, for example when you conduct market research, it is important to ensure that the information is recorded accurately, kept secure, and archived correctly. In South Africa, the Protection of Personal Information Act (POPI) requires local businesses to be responsible when collecting, processing, storing, and sharing anyone’s personal information. Examples of personal information for an individual include: phone number, email address, physical address, and employment information.
The POPI Act states that information collection must be done with the individual’s consent, and the reasons for collecting and storing personal data and how it will be stored must be clearly explained. The POPI Act holds businesses accountable should they abuse or compromise a third party’s personal information in any way. There must be adequate measures and controls to protect information from theft or being compromised. For example, information must be stored on your company’s secureserver that is only accessible with a password. You should never store information on a memory stick as you could lose it, or it could be stolen, and others could access personal information.
You must also ensure that you record and capture information correctly so that it is accurate and up to date. Once you have collected information, your company is responsible for maintaining it.
If you do not ensure that the information you rely on is current, this could have a negative effect on your company and the ability to make informed decisions. For example, if you did market research three years ago, you can’t assume that the enrolment numbers are still the same; they may have risen, or they may have dropped as certain courses may no longer be offered. Ten years ago, your research may have shown no interest in apps, but now there may be a huge demand for them. If you don’t provide current information, your company could publish a product for which there is no market or miss out on a new opportunity.
While you are working on a research project, you can either save the documents in a folder that only you can access and email it to those who require it when it is complete. You could also work in a shared folder so that others are able to view your work while it is in progress. You need to work out which option is best.
Whichever way you work, there should be a standard procedure for naming files so that the subject matter of the document is clear. Use standard file-naming conventions, or your company’s conventions. Include the date at the end of the filename so that it is clear which is the latest version. For example, if you are doing research for a product about career choices, call it ‘Market research Career choices_20XX.03.02’. It is always a good idea to password protect documents, especially if the information is sensitive or confidential.
Once you have completed research and you no longer actively use the data, it should be archived, which means moving it to a separate storage device, an archive folder, or an archiving or document management system such as Digital Cabinet, Documentum, or PaperTrail. Data that is archived is still of value, as you may need to refer to it in future. It is important to note that cloud storage sites such as Dropbox, Google Drive, iCloud, and OneDrive are not secure enough for business use.
Companies often use standardised documents or templates to ensure that the information that is gathered is complete and consistent. This makes the information easier to work with and means that it can be comparable over time. For example, if your company has a specific template for research reports, this means that anyone else can easily pick up what you have done, understand it, and keep working in the same way if necessary. If a different person has to do research for the next edition, as long as you have saved and named the file clearly and correctly and archived it in the right place, they will be able to find the information they need easily and use it to inform their research.
If there are no templates in place, and no systems in place for naming and storing files, this would mean having to start from scratch each time you did a new research project, which wastes time and means that the company loses the important historical information and intellectual property generated by research.
After studying this section, you should be able to:
- Evaluate the purpose of analysis, analysis tools and their relevance
- Assess the use and application of statistical data in the publishing sector
In order to analyse the data you have collected, it needs to be recorded in such a way that makes analysis as easy and automated as possible. Certainly, recording your data in an electronic format rather than writing it in a paper-based ledger is much better.
It follows then that the same types of records must be formatted in the same manner. The format of the data must be consistent within each category, i.e. if a category is dates, then all the dates should be in the same format, e.g. dd/mm/yy.
The most logical way of organising your data is in a data table, with each record entered on its own line. A common method of organising data is in a spreadsheet: Microsoft Excel© is the most frequently used. Data may be entered into the spreadsheet in columns and rows, with the columns each representing a unique category of the data, and the rows each containing one unique record, or piece of research, or observation. Because Excel is specifically designed to allow you to manipulate large quantities of information recorded in a table format, it is much better than using a word processing program.
Also, because Excel is such a commonly used program, it is easy to share your data with others, either in its originally recorded form, or once you have analysed it in order to gain some understanding from it. From here on we will assume that Excel© is the format of choice.
Data needs to be organised so that it can be analysed and so it should be grouped into pieces, or categories with the same characteristics, and each category should be uniquely named or labelled.
A well-conceptualised and logical way of setting up categories will make the analysis much easier. It will add credibility to the conclusions of your research. Examples of how data could be categorised are: gender, age, first-year students, second-year students, post-graduate students.
Often, the way in which you categorise your data will be guided by existing conventions – ways in which others have categorised or grouped the same sort of data in other data collection projects. Whether you use existing methods or decide on your own set of categories, you should be very clear on the rules that you use to categorise your data, so that there is no ambiguity or guesswork when the data is recorded. A good way of doing this is to record your decisions in a tab in the spreadsheet as you go, or to record a key to the colours you have used, for example, in another tab.
Putting your data into meaningful categories will also help with understanding the results of the data collection observation or research and make it simpler to find specific pieces of data.
Errors in your data will not only result in incorrect interpretation and results, but when other people pick up errors when they are reviewing the data, they may start to question how credible and reliable your data is.
You can make errors by recording the data collected incorrectly, e.g. by writing down or typing the wrong information. If your data is incomplete, that will also create errors in the evaluation, and so will data which doesn’t logically relate to the research or fit with other data you collect – for instance if you are researching what books children prefer to read but you record what clothes they like to wear.
Another type of error could occur if you select a sample which is too small to properly represent the research population as this will create a bias in the results, e.g. if you are researching what books children prefer to read but you only ask seven-year-old girls.
In statistics, the total group of subjects from which you plan to collect data is known as the population, and the sample is the section of the population from which you collect your data. For example, the population would be all Grade 1 teachers in your province, and the sample would be Grade 1 teachers from the 200 schools which you collected data from.
Although there is always a risk of making mistakes in collecting data for future analysis, there are ways to minimise the risks. Supervising the process is most important.
By planning how you are going to collect and record your data, including accurate recording methods and pre-planned categorisation, certain errors can be minimised. If you can, do a trial run of a small sample and evaluate whether you need to adapt your plan.
Excel© has some useful features to find possible errors: it can indicate if a cell’s contents differ to those adjacent to it, find blank cells, and validate data as you enter it to allow only a certain type of data to be entered or to avoid duplicates. Although it will take you some time to learn these functions, they may help in catching the errors which would otherwise compromise your analysis.
It is very important that all of your collected data is thoroughly checked and all errors are corrected before you do any analysis.
Before beginning your research and collecting data, it is essential that you clearly define the aim of your research, plan how you will record and analyse the information recorded, and decide what is a workable sample.
You should decide on the process of collection and recording: how it is to be collected (whether by electronic survey, or on a written questionnaire, later input into a spreadsheet). Generally, a simple method is the better option.
Make sure that your research plan is appropriate for your approach, e.g. if you are going to do quantitative research, then allowing participants to choose from provided options may be better than using open-ended questions. But open-ended questions may yield good results if your research is qualitative. Either way, make sure that the person or people gathering the data is well-briefed and trained.
Online data collection is much easier than manual collection, but the data analysis can become complex. In fact, online data collection, especially of Big Data (very large sets of data, gathered automatically) is a rapidly changing technology, with whole new industries evolving focused on data mining, analytics, and artificial intelligence algorithms. This new trend is shaping our world and is very important to understand. For now though, we will concentrate on more conventional methods as these are likely to be what a commissioning editor actually uses.
You should keep a record of who was included and excluded in the research process and the reasons for selecting your sample, ensuring that it represents the population correctly. You should also record each interaction, the date, and each attempt at making contact too, as often you may attempt to contact people but never hear back. If you date each attempt, you can try again with a follow-up email a week or two later.
It is advisable to keep notes during a conversation and then write up your full notes immediately afterwards so that it is fresh in your mind, using the person’s words. You won’t remember everything if you leave it too long. It is easy to record your interaction on a cellphone, by using speaker phone, for example. Remembering the gist of a conversation means you cannot "quote" participants, whereas if you have recorded it, you can quote directly.
Once you have finished collecting of data, you must ensure that all the data is input into spreadsheets accurately and completely so that you can begin the analysing.
While statistical analysis is a complex and specialised field, the types of results from the analysis you would commonly want to determine would be the following:
- Number of common occurrences within each category
- Trends and associations between categories
- Trends across geographical, age, gender, income, social, and other parameters
- Historical trends may predict a view of the future
- Spread or grouping of results
- Averages, skewness, outliers
The results must ultimately refer back to the aims of the research that you defined at the outset: what did you set out to prove or find out?
Your research data becomes information through the process of analysis. Its value is measured by the decisions which may be made on the basis of the information.
To make publishing decisions based on the research analysis, it must be saved, stored, and made available to decision-makers.
You may be required to hand out printed results of the research (for example, for discussion when you propose new products to senior managers). But you will also often provide access to digital versions of the research through internet-based communication channels – for example, email or intranets.
It is also important that in providing access to the information, you keep it secure so that it cannot be changed or corrupted by others.
Think about what would happen to your research if you left the company or changed roles within the company. You need to be sure that the next person who needs it will be able to find the research, and understand how it has been gathered and how it has been analysed. Label your electronic files carefully and obviously, and store them in an accessible place. The money that the company has spent conducting the research will be wasted if it is impossible for the next person who needs it to find the latest version, or the final results.
Any conclusions you make will only be as good and reliable as the data and analysis that lead to those conclusions. For example, if you have researched the children’s book market, then any conclusion about medical textbooks will be completely unfounded. This is obvious, but it is all too easy to make research mistakes, such as asking the wrong questions (and therefore getting answers that do not relate to your research aim), when you are doing your first batches of research. That is why doing a trial is worthwhile – but remember to take the trial right through to the analysis and reporting stages. This will help you identify any mistakes you might have made in setting up the questions or choosing the participants. Doing a trial is especially worthwhile when you are doing large-scale research. For smaller-scale research, it may not be practical.
It is important to select the correct type of analysis that is most relevant to the specific publishing research you are performing.
Also remember that research which is based on historical behaviours (what people have done in the past) is limited by the fact that people can change their preferences quickly and that your conclusions must consider the way that trends are moving.
However, the data from your research will guide you in decisions far better than if you had no data at all. Whatever decisions are taken, they must be supported by the analysed data and sound reasoning. You can expect to be asked how you came to make a decision on the basis of the data analysis. The use of the categories of data you initially defined will be most useful now.
Look at a data category and focus on where most of the same responses occur. Then group these into sub-sections within the whole data set or category. For example: your research into what books children enjoy indicates that the category they prefer is animal stories. By grouping them into smaller sections or sub-categories (e.g. dogs, cats, mice, rats, horses) you may find that girls prefer stories about dogs, while boys like horse stories. In this way, you effectively take all of the responses and group them into meaningful, similar sections which will guide decisions such as: if we are going to publish a book targeted at girls, it should probably include stories about dogs.
Remember that your sample, and the data from the research, may deal with only a small part of the market segment, or market. It may represent your incomplete knowledge about a competitor. Despite your best attempts at conducting well-planned research, you may be piecing together a recommendation on what and how your company should publish based on a thin and incomplete slice of information you have gathered. While you have been as scientific as you can, using the sampling, data analysis and other research tools discussed, you only see a small part of the whole picture. Your knowledge is incomplete, and can only be incomplete. So it’s important to take a step back from the research you’ve done, and ask yourself two questions:
- What do I not know?
- What do I know about the market, market segment, and competitors apart from the information gathered and interpreted in the research?
- In that context, how should I interpret the research findings? For example, if your finding is that there have been no South African cake recipe books published in the last two years, but you also have evidence that there is a trend towards sugar-free low-carbohydrate diets, you can contextualise this. You might conclude that there probably isn't a gap in the market for a cake recipe book even though it seems that there might be one, because recipe book trends show a move away from cakes.
Once you have finished analysing your data, the analysis should provide answers to the questions posed at the outset, as well as explain causes for events and ideally remove ambiguity (or uncertainty) in the data.
By updating old, outdated information, your analysis should give you insight into and understanding of market trends, as well as the preferences and behaviours of your target audience.
It may enable you to learn the purchasing habits of book buyers and, very importantly, provide the tools and knowledge for improved budgeting.
Effective analysis forms a crucial part of the motivation which you need to present to management in a publishing proposal: it will support decisions about whether or not to publish a particular project. It should minimise the risks associated with those decisions by providing meaningful background and logic. It is particularly relevant in order to improve the quality of decision-making in the business and as a result enable the business to achieve its strategy. (See Chapter 4 for more on publishing proposals.)
Ideally, the analysis will initiate action.
Ultimately, if the analysis assists in reaching a sound, well-informed conclusion, then it has done what it was meant to do.
Lastly, you should be aware that there are many visual ways of displaying your data, and showing what the data tells you. No doubt you have seen presentations which feature graphs of different types. Some software programs have built-in graph functionality which you can use to depict the trends highlighted by your data analysis.
Examples of analysis tools include:
- A histogram. This is a graph that shows how often each different value occurs in a set of data.
- A scatter diagram. This is a diagram that creates pairs of numerical data to look for and demonstrate a relationship between them.
The process of analysis
determines how individual pieces of data are related
to others. By identifying these relationships and interpreting them, you can identify
important details that will support
the decisions mentioned in Section 3.5.8.
There are many types of statistical relationships; some of the more typical ones you should be able to identify include:
- Sequences: can you see a repetitive cycle, such as the highest quantity of textbooks being sold at the end of the year, year after year? Perhaps there is a seasonal trend? An example of this would be more exam practice guides for secondary school learners being sold just before prior May or November exams.
- One to one, one to many, many to one, many to many. For example, does one single piece of data relate to only one other single piece of data, or does it have a relationship to a number of pieces of data?
- Regression analysis: This is about the relationship between variables, e.g. the cause and effect between the price of a book and the quantity sold, suggesting how a change in price might affect how many are sold.
- Correlation analysis determines if there is a relationship between variables and how that relationship may be used in forecasting, e.g. does a cover title in red appeal more to boys than girls, and if so, should boys’ books have red titles to maximise sales?
- Distribution: This examines how the data is spread over the spectrum of results from the minimum to the maximum, and whether there is a grouping or cluster around a particular point
- Time series analysis: This can be used to forecast the future based on historical data, e.g. in the previous year, more books on cars were sold in the period leading up to the festive season and the same will probably occur this year; or perhaps the data shows a steady increase or decrease over a period of time.
3.6.1 Report-writing skills
A report is a concise document that presents facts. In a report, you set out a problem to be resolved, analyse it, and then make recommendations based on your analysis of the facts.
Informal reports are generally short and can be in the format of a memo or an email. Informal reports are aimed at a smaller audience than formal reports, i.e. one person or a small group.
Formal reports are official written reports that include the full details and data required to make a business decision. Formal reports can be:
- Informational, to provide more information on a topic
- Analytical, to analyse a situation and attempt to solve a problem, or
- Recommendation reports.
Because formal reports have to be clear and well-structured, they are divided into sections with numbered headings, and include a table of contents at the beginning. This helps the reader to find the information they are looking for easily.
The sections you include in a report will depend on the brief you are given, so always keep the brief in mind. Below is a list of sections that are often found in research reports, but not all are necessary for business reports:
- Title: This should be short and clearly indicate what the report is about. Table of contents: This is a list of the sections with page references.
- Executive summary: This is the first section and sometimes the only section that will be read, so it should include all the important details. It is usually one to two paragraphs and never more than a page long.
- Introduction: In this section you explain the reason for the report and provide some context for the reader.
- Methodology: Here you clearly explain step by step how you conducted your research, in a way that someone else could conduct similar research in future.
- Results: In this section you present your results or your data in a way that is very easy to understand. Decide the best way to show your results, i.e. text, graphs, tables, diagrams, or a combination, but don’t show the same data in more than one way. Give each figure or table a clear caption and ensure that they are labelled.
- Discussion: This is usually the longest section, in which you discuss your findings relative to the brief you were given. Also include any difficulties you experienced.
- Conclusion: This is a short section that summarises the report and indicates how your report has answered the original brief. You may also include your recommendations in the conclusion.
- References: List any content that you have referred to in your report in this section, ensuring that you follow the appropriate referencing system, for example, the Harvard System, the Chicago System, or the American Psychological Association (APA). If you are unsure, be consistent in your references and ensure that you include enough information to enable the reader to find the content if they would like to.
- Appendices: If you have extra valuable information to supplement the report, for example, course outlines, a glossary, transcriptions of interviews, include them as labelled appendices (for example, Appendix A) and refer to them at an appropriate point in the report.
A report represents what you have found during your research in a physical, visual form. There may be times when you are required to present your report to others. To do this you should use presentation software such as Microsoft PowerPoint® or Prezi to create slides that you can project on a screen for everyone to see.
When creating a presentation from your report, the most important thing to remember is to present only the key information and not to have too many words on the screen. Try to turn words into pictures, tables, or graphs that convey the meaning in a visual way. When you use words, there is no need for full sentences.
It is a good idea to start at the end of your report, with your conclusion and recommendations. Present these first and then create a presentation that leads to this conclusion and your key findings.
When you create a presentation, bear these points in mind:
- What was the goal of your research?
- Who will be watching and listening to your presentation?
- What response would you like from them?
- How did you go about your research?
- How can you structure presentation in the best way?
- How can you grab the attention of your listeners at the beginning of the presentation? Is there an interesting quote you could use?
Once you have created your presentation, practise presenting it so that you become familiar with the content and ensure that you stick to the allotted time for presenting. You should also rehearse using the equipment and technology you will be using. You should end by summarising your conclusions and recommendations, and always allow time for questions. You may choose to give attendees copies of the research report, or summaries of it, or a copy of your presentation to look at while you talk.
While you present, remember to keep eye contact with people around the room. Smile. Keep your hands relaxed – either hold them at your sides, or use your hands to make gestures and point out certain elements on the screen. Use your voice so that it doesn’t sound monotonous. Remind yourself that you are the expert on this topic in the room – no one else knows as much as you do, and your job is to teach them what you have learned.
Chapter 4 and 11 also deal with presentation skills, for presenting a publishing proposal, and presenting in a sales context.
Market intelligence is information that gives an overview of what is happening in your market on an ongoing basis. As we’ve discussed earlier, it looks at many different business areas, such as competitors, products, pricing, trends, and customer feedback. Below are the sections that should be included in a market intelligence report:
- Executive summary: Summarise the main points of the report. If someone was only going to read this section, they should know everything they need to know by reading it. Mention why you did the research, what you found, how this affects the company, and make suggestions for what should happen next.
- Background: Explain the context and rationale for the research.
- Methodology: Discuss the types of research employed and your methodology. Target market: i.e. Who would buy the product?
- Size of the market: total actual market, potential actual market, realistic actual market
- Market share: Explain the percentage calculation you use in the RAM. If your report deals with the education sector, and you have actual adoptions for a university textbook available, for instance, include these in a table.
- Sales history: A table or chart indicating the sales history for the product, including year-to-date sales in the current financial year
- Market insights: Extract and summarise these from your market research, including customer insights.
- Feedback from the sales team: Include any feedback from your sales team, from emails, conversations, or from the Customer Relationship Management system.
- Market requirements: Extract and summarise these from your market research and the sales team feedback.
- Competitor analysis: Summarise your findings.
- PESTLE analysis: Analysis of the relevant current political, economic, social, technological, legal, and environmental factors that affect the market (see more in Chapter 4)
- Key findings: Summarise your key findings.
- Recommendations: Make product recommendations based on your key findings, including print and digital products. What should the ideal product look like, who should write it, and what additional features should accompany it to ensure that the market is satisfied?
- Experts in the field/potential authors: Identify highly-regarded experts and possible authors you have encountered during your research.
Remember to ensure that you record the data accurately and store it securely. Market information is important information that can inform your company’s strategy and grow the business.
Assignment 08
Assignment 09
Last modified: Thursday, 18 May 2023, 7:25 AM
